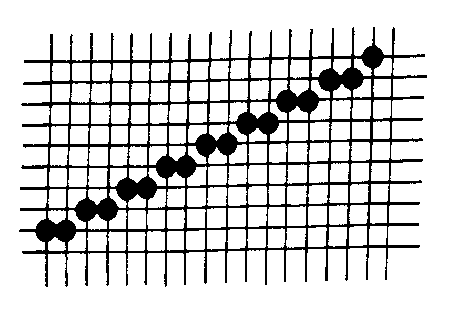
Example of DDA Output.
Drawing Straight Lines (Polyline in GKS).
Copyright (c) Susan Laflin. August 1999.
Consider the problem of instructing a computer to draw a straight line from A to B, where A and B are points on a computer screen.
To define the position of A and B, we need a coordinate system and the values of the cordinates of A and B in terms of this system.
At the lowest level, the points may be defined in terms of pixel positions on the screen. This uses "device coordinates" and is the system used by most DDA algorithms to illuminate the actual pixels needed to produce the line.
At a higher level, most problems in graphics work in terms of "world coordinates" and we shall discuss the equations for straight lines in terms of these. They are Cartesian coordinates with the x-axis horizontally towards the right and the y-axis vertically upwards.
Other coordinate systems, such as polar coordinates, will not be discussed here.
Most graphics systems provide automatic transformations from world coordinates, either directly to device coordinates or via an intermediate set of "normalised device coordinates".
Equation of a Line
The equation of a straight line joining the points P1 (x1,y1) and P2 (x2,y2) may be written :-
P=(1-s) P1 + s P2
where the parameter s takes values between 0 and 1.
When s=0, the equation gives the point P1 and when s=1 it gives the point P2.
When s=0.25, the equation calculates the point at a quarter the distance from P1 to P2.
This equation gives you the pair of equations, one for the x coordinates and the other for the y coordinates, namely:
x=(1-s) x1 + s x2
y=(1-s) y1 + s y2
Values of s between 0 and 1 may be used to calculate points along the line
between P1 and P2.
Values of s less than 0 or greater than 1 give points on the extensions of
the line beyond P1 or P2.
If you only want the finite segment of the line starting at P1 and stopping
at P2, then you must reject any values of s outside the range 0 to 1.
Example: consider the line from (2,2) to (6,4).
This gives the two equations
	x=2(1-s) + 6s 	and 	y = 2(1-s) + 4s
Then 	s=0.0 gives x=2   and y=2.
	s=0.2 gives x=2.8 and y=2.4
	s=0.4 gives x=3.6 and y=2.8
	s=0.6 gives x=4.4 and y=3.2
	s=0.8 gives x=5.2 and y=3.6
	s=1.0 gives x=6   and y=4.
These values may be plotted on graph paper to give the required straight line.
Intersection of Two Lines
If the one line has the equation	P=(1-s) P1 + s P2
and the other line has the equation	P=(1-t) P3 + t P4
then to calculate the point of intersection of these lines, you
need to find values of s and t which will give the common point.
i.e.	(1-s) x1 + s x2=x = (1-t) x3 + t x4
and	(1-s) y1 + s y2=y = (1-t) y3 + t y4

rearranging this pair of equations gives

        s=t (x4-x3)/(x2-x1) + (x3-x1)/(x2-x1)
and	s=t (y4-y3)/(y2-y1) + (y3-y1)/(y2-y1)

This can be rearranged to give the expression for t, namely:

	((y3-y1)/(y2-y1)-(x3-x1)/(x2-x1))
     t=	---------------------------------------
	((x4-x3)/(x2-x1)-(y4-y3)/(y2-y1))
Problems arise if either x2=x1 or y2=y1, but in this case the line is parallel to one of the axes and the whole equation becomes very much simpler.
More seriously, if the divisor in the last equation is zero, it is not
possible to calculate t.
This occurs when the two lines are parallel so that
(y2-y1)/(x2-x1)=(y4-y3)/(x4-x3)
and you know that parallel line segments do not have a point of intersection,
although the lines through the points may be said to meet at infinity.
Finally you should note that if either the value of t or the corresponding value of s lies outside the range 0 to 1, then the two segments P1P2 and P3P4 do not intersect although the infinite lines through these points may do so.
Mapping on to the Computer Screen
To discuss these algorithms, the coordinates will refer to pixel-positions on the screen of a raster terminal. (For example, an EGA card will have 640 positions along the x-axis and 350 along the y-axis, any one of which is assigned one of the 16 possible colours) To draw a line from a point A (X1,Y1) to the point B (X2,Y2) at some angle across the screen of the terminal, each pixel on the line must be changed from the background colour (usually black) to some other colour (white for example). Any algorithm used to generate this output must satisfy the following requirements:
1) Lines should appear straight and terminate accurately.
Most algorithms draw lines which appear straight. Some allow roundoff errors to build up so that a line from A to B followed by a line from B to C will not meet at B but will either cross or leave a gap. This not only looks bad, but may cause serious problems if you then try to flood-fill a polygon. Also, when attempting to erase a line, it may be found that the line AB does not colour the identical pixels to the line BA.
2) Lines should have constant density, independent of their length.
Most algorithms satisfy this criterion, since it is usual to generate points at a given step-size rather than a given number of points per line.
3) Lines should be drawn rapidly.
Speed of drawing is a very important consideration when comparing algorithms for producing straight lines.
The most widely-used class of algorithms for these methods are the "DDA" or "Digital Differential Analyser" algorithms which are derived from the expression for the first derivative of the curve in question. (Note that this is constant for a straight line.)
The starting point (X1,Y1) corresponds to the pixel coordinates IX and IY and this pixel is illuminated. To get the next point on the curve, we must add an increment dx to X1 and an increment dy to Y1, and then work out the corresponding pixel coordinates. If these give the same values IX and IY, then the pixel is already illuminated and won't get any brighter so there is no need to do anything. If these give a different value for one or both of the coordinates, then we must illuminate the required pixel. The DDA algorithm gives a method of calculating the dx and dy to obtain the next point.
When we are dealing with a straight line, the DDA algorithm has a
particularly simple form. If the line runs from the point (X1,Y1) to (X2,Y2),
then the equations are:
dy=f * (Y2-Y1)
and dx=f * (X2-X1)
for some scaling factor f. When f is a very small number, we may find it takes
several iterations to get from one pixel position to the next one. On the other
hand, when f becomes too large, we find the method skips over several pixel
positions and produces an irregular dotted line rather than a continuous one.

Example of DDA Output.
This example corresponds to the "Simple DDA algorithm."
Simple DDA Algorithm
Initially this will be discussed in terms of output to a raster terminal. For this algorithm, it is necessary to choose f so that either dx or dy is of unit magnitude. The other step size will be less than or equal to one in magnitude, and may be positive or negative in sign. At this level of programming, the pixel positions on the raster grid of the screen are indicated by integer numbers, and the coordinates x1, y1, x2 and y2 which are supplied to the algorithm are expressed in terms of these integers. The command "putpixel(x,y)" illuminates the pixel at position (x,y) . Then, in Pascal-like notation, the following algorithm may be used.
Input data x1,y1,x2,y2
Set dx:=(x2-x1); dy:=(y2-y1)
If abs(dx)>abs(dy) 	then f:=1/abs(dx); n:=int(abs(dx))
			else f:=1/abs(dy); n:=int(abs(dy))
Set dx:=f*dx; dy:=f*dy
Set x:=x1; y:=y1
For i=0 to n
	Putpixel(x,y)
	Set x:=x+dx; y:=y+dy
Repeat
End
Since a unit step has been chosen in at least one direction, it is certain that another pixel must be illuminated on each iteration around the loop. The type of output is illustrated in the previous figure, where dx is larger than dy and so the next pixel in the x-direction is always illuminated, while in the y-direction there are some cases with several pixels illuminated with the same y-value. There have been many actual implementations of these algorithms, since Bresenham's Algorithm was published in 1965, and although the basic idea remains the same, details of the method vary from one implementation to another.
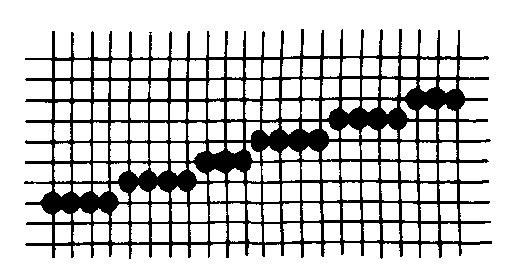
To produce suitable output for many pen-plotters, you will need to refer to the directions of the elementary plotter steps and the DDA output of the above figure . This must be preceded by a command to move the pen to position (x1,y1) and then the sequence of plotter steps (e.g. `0101010101010101') to move one step in the required direction for each increment. The pattern shown in the next figure corresponds to the sequence `000100010010001000100' and each set of DDA output can be coded for a plotter in a similar manner.
DDA Output for Curves
Any curve for which the equation can be expressed as increments dx and dy added to the previous values of x and y can be used to generate a DDA algorithm. Later in this text, equations in this form can be found for ellipses and other conic sections. Chapter Two of the text by Newman and Sproull discusses several attempts to find a DDA algorithm for a circle, but the problem of roundoff errors which build up during a calculation is particularly severe in this case. Another problem relating to this output occurs when the distance between pixels in the x-direction is not exactly equal to the distance between pixels in the y-direction. In this case, a circle-drawing DDA algorithm which was correctly defined in terms of pixel-steps would produce an ellipse not a circle when it appeared on the screen. The correct algorithm in this case would be an ellipse-drawing algorithm whose eccentricity corrected the ratio of pixel-steps in the x and y directions.
Although the early work on DDA algorithms was completed in the 1960s, the topic is not dead. One of the more important papers at the Eurographics conference at Manchester in March 1989 related to a new approach to a DDA algorithm for cubic splines. The paper, by F.J.Smith & S.Leitch, appeared in Computer Graphics Forum Volume 8 No 2 (June 1989) and is summarised here. They were concerned that the usual method of calculating many points along a cubic spline and then joining them by straight lines was both inaccurate and wasteful of computer time. Taking the case where y is calculated as a cubic spline in terms of x and setting out a difference table from an initial two points, they discovered that the increment dy could be evaluated by two integer additions instead of re-calculating the cubic each time. They went on to discuss the number of iterations which could be carried out before the accumulated error was greater than the step-size between one pixel and the next and concluded that in many cases their algorithm was more accurate then the traditional polyline approach as well as being faster. Students should consult this paper for full details of this work.
GKS Polyline Output.
The exact form of the subroutine call to polyline is determined by the language binding for the particular language being used. Functionally, the user must supply the number of points and the world coordinates of those points. In FORTRAN for example, the parameters are an integer N containing the number of points followed by two one-dimensional real arrays X and Y containing the world coordinates. In Pascal, on the other hand, the coordinates are expected in an array of records, each record having two components which are the real values x and y.
The polyline output function draws a line from the first point to the second, the second the the third and so on. No attempt is made to produce a closed polygon - this only happens if the first point and the last have identical world coordinates.
Polyline must always have at least two points. Two points will produce a single line joining them.
Resolution and "Jaggies"
The resolution of a terminal is determined by the minimum step-size in x or y, so is either the smallest distance a pen may be moved on the plotter or the distance from one pixel position to the next. A "high-resolution" terminal has a very small step-size and so is capable of high quality output.

DDA Output with Jaggies
The above figure shows an enlargement of a raster screen with a line across it. At each crossing point, the pixel may be illuminated or not and by looking closely at the line, distinct rows of dots may be observed with steps when the output moves to the next row. This effect is referred to as "jaggies" and is particularly unpleasant on some low-resolution terminals. However even good quality output shows the same behaviour when viewed through a sufficiently powerful magnifying glass.
If the terminal is a monochrome one with only two levels of output, then nothing can be done to remove these jaggies. If it is possible to use a grey-scale terminal, then there are methods to give a better appearance to the output. These rely on the tendency of the human eye to join things up in straight lines. While this may be a disadvantage in some cases, such as the famous problem of the illusory canals on Mars, it can be put to good use in the method presented by Gupta and Sproull at the 1981 SIGGRAPH conference.

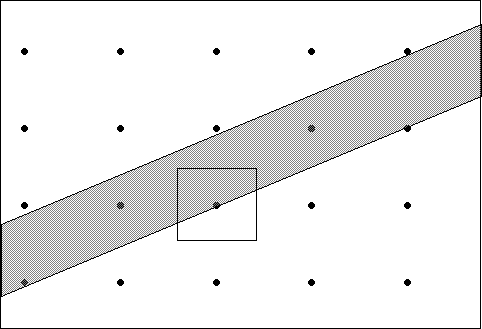
Grey-shading algorithm.
In the above figure, the dots indicate the raster positions across the screen and the shaded area is the line we wish to draw. Now imagine that each dot is surrounded by a square large enough to cover the whole area. Many of these squares are intersected by the shaded area and so it is possible to calculate the depth of grey proportional to the amount of the square which is shaded. The paper by Gupta and Sproull discusses various mathematical techniques to calculate these grey values and proposes an algorithm with look-up tables to give the speed required for interactive output.