Shift Transformation
Transformations in Two-dimensions.
Copyright (c) Susan Laflin. August 1999.
Once a diagram has been defined in terms of straight lines expressed as the values of their end-points (x,y) in some Cartesian coordinate system, you may wish to change its position, size or orientation. All these involve the use of transformations to map from the old values of the coordinates to the new ones, after which the diagram is redrawn in its new position.
Shift Transformation or Translation.

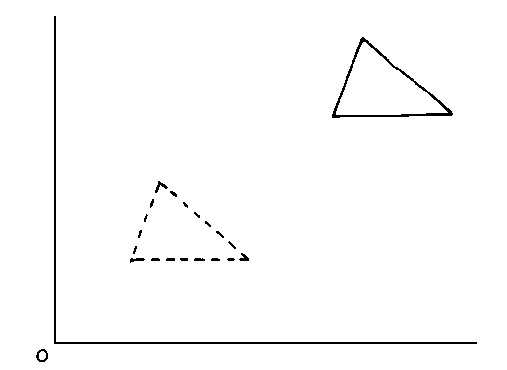
Shift Transformation
This is the easiest transformation to visualise. It involves shifting the whole diagram to a new position while leaving its size and orientation unchanged. The above figure shows the shift transformation applied to a triangle to move it from its old position (shown by solid lines) to its new position (shown by dashed lines).
This involves a recalculation of each pair of (x,y) values using the
formulae connecting the old values (x,y) and the new values (x',y').
x'=x - xt
y'=y - yt
These may also be written as the single matrix equation
	|x'|		| 1	0	-xt|	|x|
	|y'|	=	| 0	1	-yt|	|y|
	|1 |		| 0	0	1  |	|1|

When this is expanded using the normal rules of matrix multiplication,
you get the following equations.
	x'=1*x + 0*y + 1*(-xt)  = x-xt
	y'=0*x + 1*y + 1*(-yt)  = y-yt
	1=0*x + 0*y + 1*1      = 1
which reduce to the first pair of equations. The third equation (1=1) is a useful check that the transformation has been remembered correctly. If you are not happy with matrix arithmetic, then you may apply each transformation in turn using the equations quoted above. This is slightly less efficient than building up one overall transformation matrix and applying it once, but so long as you are careful to apply the transformations in the correct order, the final result will be the same.
Note: If you intend to refer to other texts for details of these transformations, you should be aware that most American texts use the transpose of this matrix equation. You must be careful to read the entire equation and not just copy the matrix. It is easy to check that this form leads to the same equations.
Scale Transformation
This may be used to change the size of a diagram, by using the following pair
of equations.
x'=Sx*x
y'=Sy*y
However if Sx is negative, this transformation also causes a reflection in the
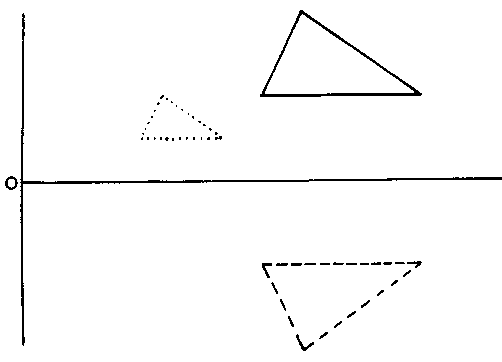
y-axis and similarly if Sy is negative. The figure below shows scaling from the old
position (solid lines) to a new position (dotted lines) when Sx=Sy=1/2 and
from the old position (solid lines) to a new position (dashed lines)
corresponding to Sx=+1, Sy=-1.

Scale Transformations
Examples of Transformations
Example One: World Coordinates to Normalised Device Coordinates.
The area xmin to xmax and ymin to ymax on to the area 0 to 1 and 0 to 1.
First shift the point (xmin,ymin) to (0,0).
	x'=x-xmin
	y'=y-ymin
Secondly scale the lengths (xmax-xmin) and (ymax-ymin) to unity.
	Sx=1/(xmax-xmin)
	Sy=1/(ymax-ymin)
and then
	x''=Sx*x'
	y''=Sy*y'
Applying this to all the points will carry out the transformation.
Example Two: World Coordinates on to part of the unit square.
The area xmin to xmax and ymin to ymax on to the area 0.5 to 1.0 and 0.0 to 0.5.
First shift (xmin,ymin) to (0.5,0.0).
	x'=x - (xmin-0.5)
	y'=y - (ymin-0.0)
Secondly calculate the scaling factors.
	Sx=(1.0-0.5)/(xmax-xmin) = 0.5/(xmax-xmin)
	Sy=(0.5-0.0)/(ymax-ymin) = 0.5/(ymax-ymin)
Finally scale the coordinate values.
	x''=Sx*x'
	y''=Sy*y'

It is easy to show that with the previous calculations for Sx and Sy,
the Transformation matrix is given by:
		Sx	0	Sx*(0.5-xmin)
	T=	0	Sy	Sy*(-ymin)
		0	0	1
Rotate Transformation
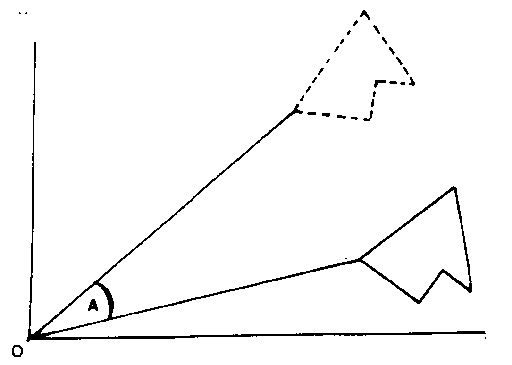
This allows the whole diagram to be rotated through an angle A about the origin of the coordinate system. The next figure shows a diagram rotated through a small positive angle A from the old position (solid lines) to the new position (dashed lines).

Rotation of Diagram
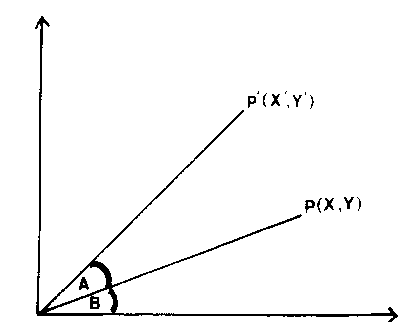
To derive the equations for this, let us consider a single point P(x,y) and use the figure below to study the geometry.
The point P is moved to P' when the diagram is rotated through an angle A
about the origin O. This means that the lengths OP and OP' are equal. If
this length is denoted by d, then
	d*d = x*x + y*y   = x'*x' + y'*y'
and
	x=d cos B 	and 	y = d sin B
similarly
	x'=d cos (A+B) 	and	y' = d sin(A+B)
	x'	=d cos (A+B)
		=d cos A cos B - d sin A sin B
		=x cos A - y sin A
	y'	=d sin (A+B)
		=d sin A cos B + d cos A sin B
		=x sin a + y cos A
These equations have to be applied to every pair of coordinates and then the new points must be joined up in the required order to redraw the diagram in its new position. As usual, this may also be expressed in matrix form :

Rotation of Point P
Example Three: Rotate the diagram through an angle A about a point P which is not at the origin.
This requires three stages:
1. Move P to the origin. (shift by -px,-py).
2. Rotate about the origin.(rotate through angle A).
3. Move P back to its original position (shift by px,py).
Now calculate the transformation matrix T from these three transformations.

	|1       0	px|	|cosA   -sinA	0|    |1    0	-px|
T=	|0       1	py|	|sinA    cosA	0|    |0    1	-py|
	|0       0	1 |	|0         0	1|    |0    0	1  |


	|1     0     px|	|cosA     -sinA	-px*cosA+py*sinA|
=	|0     1     py|	|sinA      cosA	-px*sinA-py*cosA|
	|0     0     1 |	|  0         0         1        |

	|cosA 	- sinA 		px -px*cosA + py*sinA |
=	|sinA 	cosA 		py -px*sinA - py*cosA |
	|  0	  0			1             |
Having evaluated the matrix T, you can multiply all coordinate pairs by the matrix and then redraw the diagram in its new position.